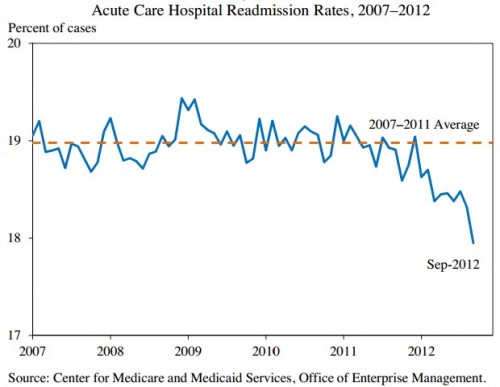
Medicare now penalizes hospitals for high readmission rates for acute myocardial infarction (AMI), congestive heart failure (CHF), and pneumonia. Anticipating the penalties,readmission rates have come down, though this does not prove a causal relationship.
The chart illustrates a highly aggregated metric. Certainly readmission rates and changes in them vary by type of patient (in any number of dimensions). For example, recent work by Matthew Press et al. suggests that changes in readmission rates vary by condition severity.
In an analysis of Medicare fee-for-service beneficiaries nationwide, we found that those with the highest clinical severity had readmission rates in 1997 that were approximately 6.0 percentage points higher than those in the lowest severity quartile, with this gap increasing to 8.1 percentage points by 2007 for AMI. The difference in readmission rates for the highest versus lowest severity quartiles for CHF was 5.7 percentage points in 1997 and 6.4 percentage points in 2007. This relatively increasing risk of readmission for the highest severity patients occurred despite the fact that average severity scores decreased within each severity quartile over the 10-year period. Length of stay and in-hospital mortality also declined for all patients; however, postdischarge mortality increased for the highest severity patients, whereas it decreased for the lowest severity patients.
The authors offer two possible explanations for these findings. First, condition severity may have worsened more than observed for high severity patients and not accounted for in the risk adjustment approach applied in the analysis. That is, the highest quartile of condition severity in 2007 may have represented sicker patients than the highest quartile in 1997 in ways that were not controlled for. Sicker patients are expected to be readmitted more. Another is that actual care delivered (e.g., quality of care transitions) worsened for higher severity patients relative to lower severity patients. This might also lead to relatively more readmissions for sicker patients.
Unfortunately, their analysis ends in 2007, well before the readmission rate reduction exhibited in aggregate since 2011 in the figure. An open question is how this downturn might have varied by condition severity.
No comments:
Post a Comment